Thanks for your interest in my project!
I have so many more figures than could ever fit on one poster, so I added this page to my website for those who would like more details. Scroll down for my complete sample, visuals and tables of my methods, and a more complete list of figures for my results.
Materials and Methods
Here is the complete list of specimens used in the project. Bolded specimens were used in the parsimony analysis only, as they were preserved well enough for trait scoring but not sufficiently intact for the geometric morphometric analysis.

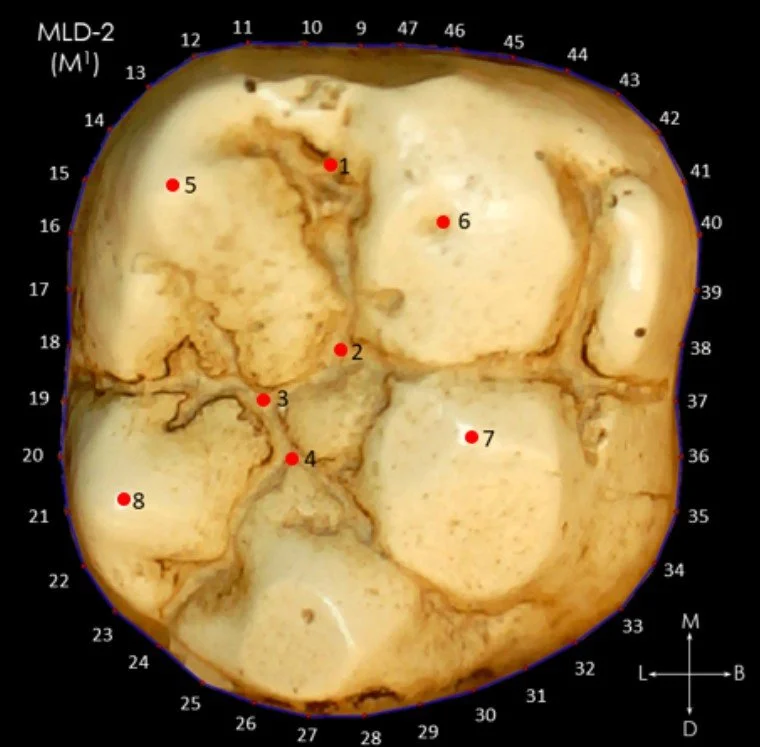
For the geometric morphometric analysis, type-1 landmarks were placed on homologous points, such as tooth cusps (5-8) or the intersection of grooves (1-4) for the premolars and molars in the above sample. Type-3 landmarks (9-47) were arranged equidistantly around the occlusal surface of each tooth. Once these data were collected, Procrustes analysis was performed to remove nuisance variables like size. Finally, principal components analysis was performed on the data and visualized in R.
For the parsimony analysis, I compiled a suite of independent characters and devised a numerical scoring schema (a standardized dental trait scoring schema exists only for Homo sapiens and is not applicable to early fossil hominins, so I had to make my own). Here is an example of the traits selected for the first and second molars. The scores were tabulated for each specimen and trees were produced with PHYLIP.

Additional Results
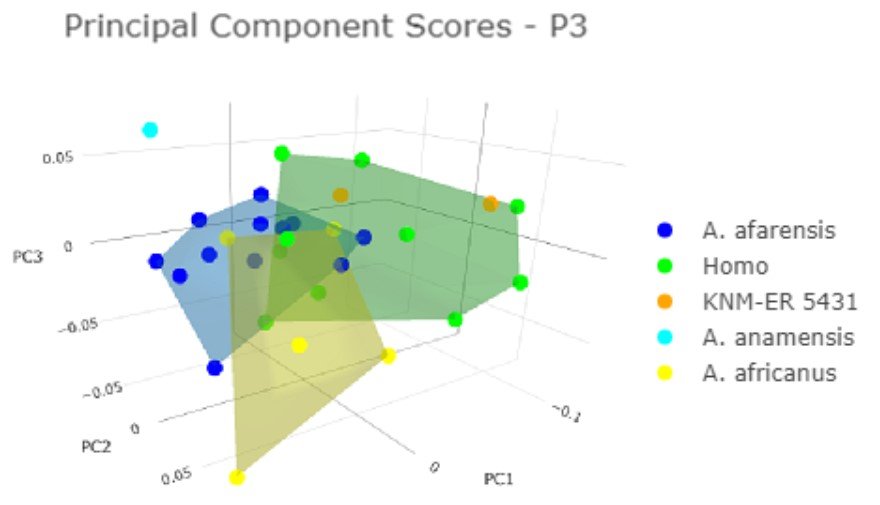
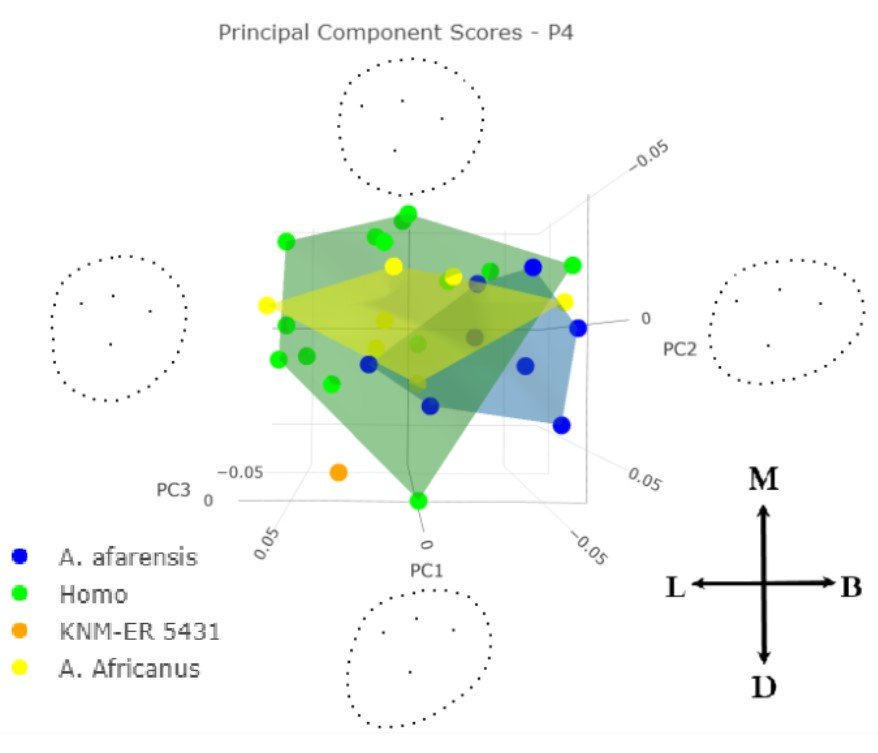
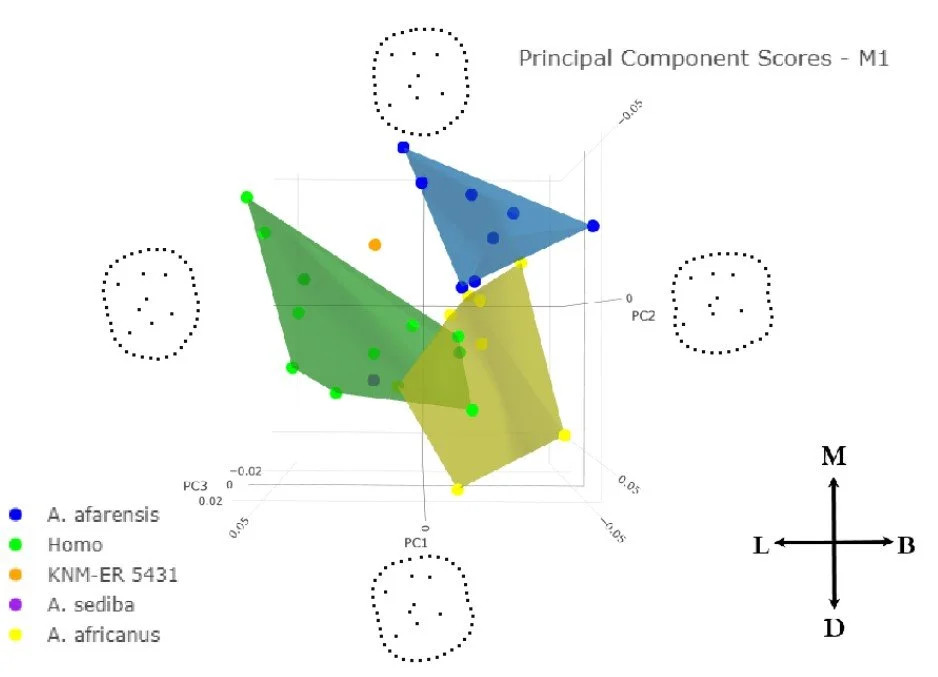
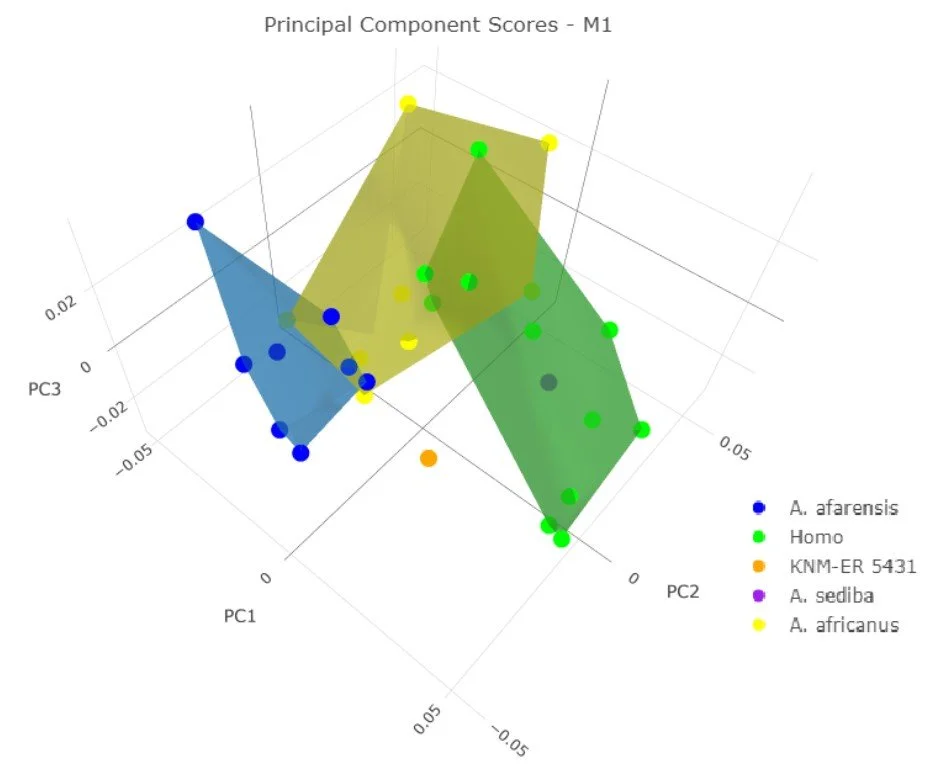
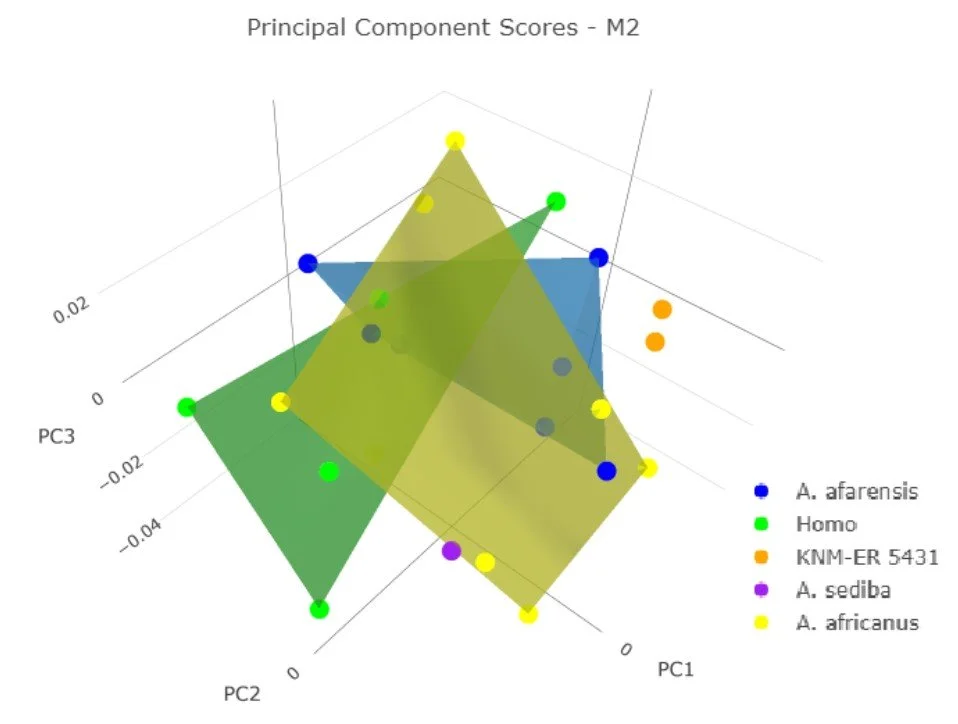
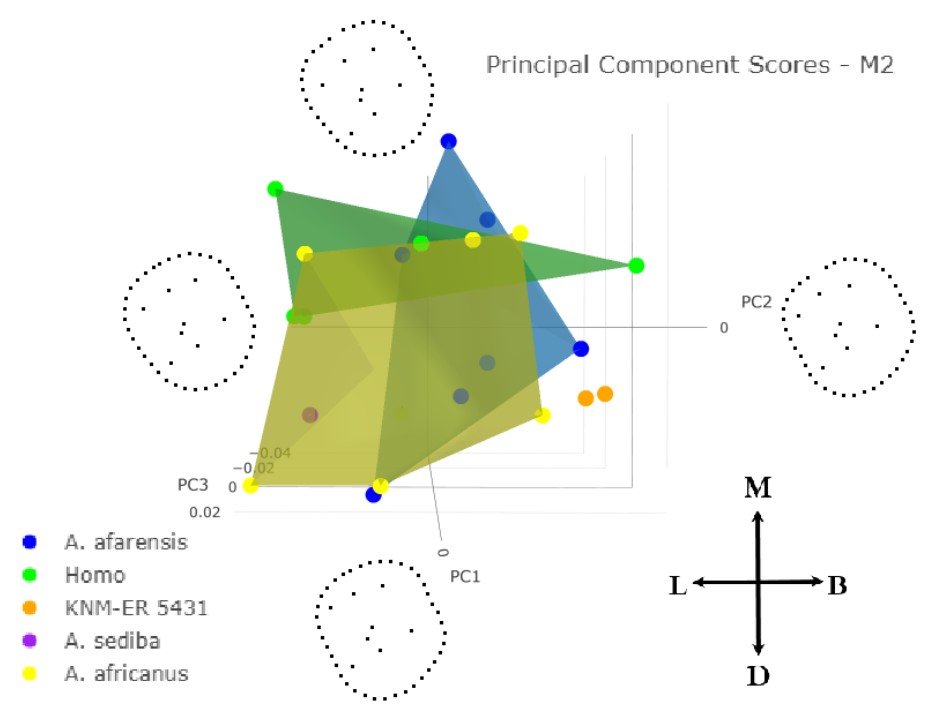
The geometric morphometric analyses of the dental landmarks were performed tooth-by -tooth, which allowed me to generate four, three-dimensional graphs to visualized principal components 1, 2, and 3 for the third premolar, fourth premolar, first molar, and second molar.
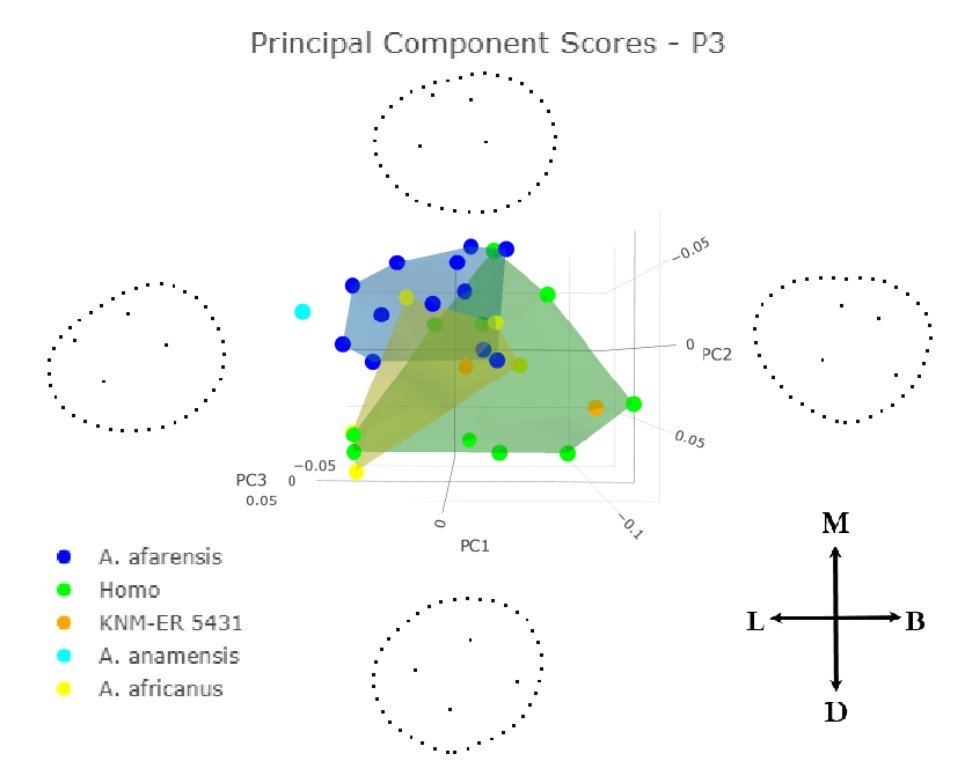
The left side images show the three axes in the best way possible when viewed on a two-dimensional, still screen. The right side images show PC1 and PC2 head-on with representative depictions of the shape variations associated with PC1 and PC2 (though, on a mobile browser, they will be one on top of the other- not left and right!)
Below, a summary of the results of these analyses.

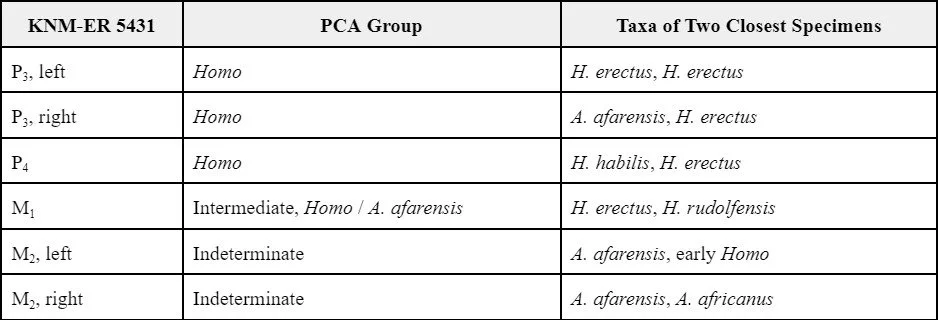
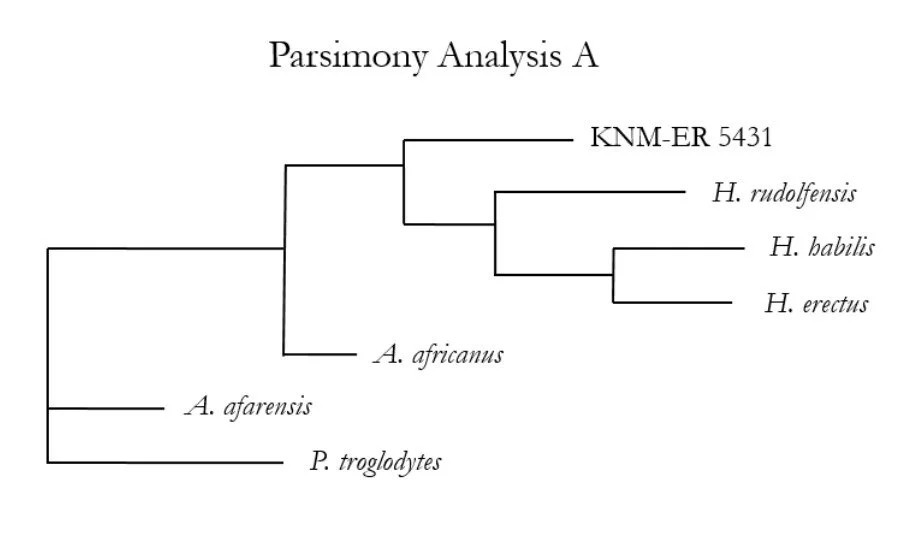
The results of the parsimony analysis, which used the dental traits exemplified in the Methods section table, are here. The tree shown on the poster (Parsimony Analysis A) is the most conservative, including only taxa or specimens represented by all the teeth associated with KNM-ER 5431 (third and fourth premolars, plus first and second molars). This was the sole, most-parsimonious tree resulting from that input.
In a more speculative analysis, I included taxa or specimens for which as little as one tooth type could be scored. This resulted in three, equally-parsimonious trees, only one of which is plausible (Parsimony Analysis B) based on a priori knowledge about the phylogenetic situation of other Pliocene hominins.
The others are still offered here, below Parsimony Analysis A and B, for transparency.